Ad-hoc way to debug output queries in EclipseLink
If you happen to debug an app running EclipseLink without a proper logging configuration, you might
find it challenging to get the final SQL query generated by EL. Usually, there are the
eclipselink.logging.level and eclipselink.logging.logger properties in the EL persistence configuration.
These control the logging behavior. With the FINE level, you can log the SQL queries for complex processes and check if they are suboptimal.
When logging is disabled or not accessible, but the JVM debug port is available, you can look for places
where logs are written out to the output stream. In the case of the EclipseLink, most of the logging is
implemented through the org.eclipse.persistence.logging.SessionLog interface:
public interface SessionLog extends Cloneable {
    //... log-related methods
    public boolean shouldLog(int level);
    public boolean shouldLog(int level, String category);
    public void log(int level, String message);
    //12 overloads...
    public void throwing(Throwable throwable);
    public void severe(String message);
    public void warning(String message);
    //5 more JDK-related log-level methods...
    public void logThrowable(int level, Throwable throwable);
    public void logThrowable(int level, String category, Throwable throwable);
    //...
}
You can put breakpoints in those, but all log-outputting methods are protected by the (message-less) shouldLog methods
from creating unnecessary objects. Another common place besides logging that has the database query in its context is profiling.
Most of the profiling in EclipseLink starts from the startOperationProfile operation in the
org.eclipse.persistence.internal.sessions.AbstractSession. Although it is an internal method subjected to change (version 2.7),
you are free to debug it to your needs.

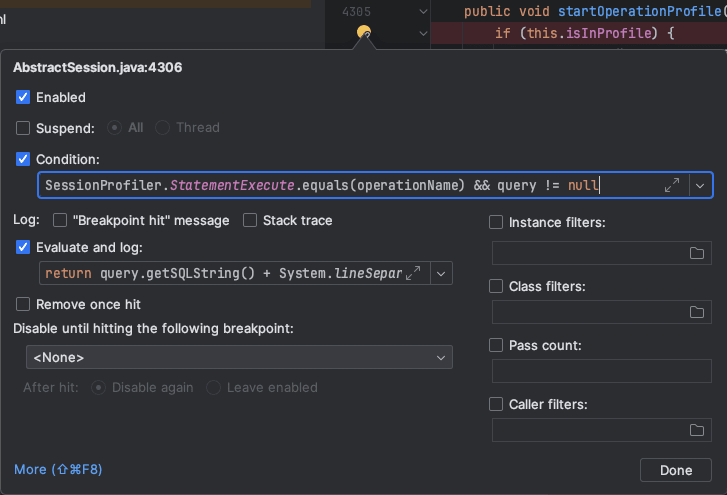
With the help of an IDE, you can output the query details into the local console.
For the breakpoint condition, check if it's a statement execution query SessionProfiler.StatementExecute.equals(operationName) && query != null.
As for the output, concatenate the SQL string with an optional translation row representing the bind parameters return String.format("%s%nBind parameters: %s%n%s",query.getSQLString(), java.util.Objects.toString(query.getQueryMechanism().getModifyRow(), ""), java.util.Objects.toString(query.getQueryMechanism().getTranslationRow(), ""));:

Without suspending the execution, sample output is generated:
CREATE TABLE EMPLOYEE (ID BIGINT NOT NULL, DEPARTMENT VARCHAR, NAME VARCHAR, ADDRESS_ID BIGINT, PRIMARY KEY (ID))
Bind parameters: EmptyRecord()
SELECT * FROM SEQUENCE WHERE SEQ_NAME = 'SEQ_GEN'
Bind parameters: EmptyRecord()
INSERT INTO SEQUENCE(SEQ_NAME, SEQ_COUNT) values ('SEQ_GEN', 0)
Bind parameters: EmptyRecord()
UPDATE SEQUENCE SET SEQ_COUNT = SEQ_COUNT + ? WHERE SEQ_NAME = ?
Bind parameters: DatabaseRecord(
    SEQ_NAME => SEQ_GEN
    PREALLOC_SIZE => 50)
SELECT SEQ_COUNT FROM SEQUENCE WHERE SEQ_NAME = ?
Bind parameters: DatabaseRecord(
    SEQ_NAME => SEQ_GEN)
INSERT INTO EMPLOYEE (ID, DEPARTMENT, NAME, ADDRESS_ID) VALUES (?, ?, ?, ?)
Bind parameters: DatabaseRecord(
    EMPLOYEE.ID => 1
    EMPLOYEE.DEPARTMENT => Marketing
    EMPLOYEE.NAME => Jane Smith
    EMPLOYEE.ADDRESS_ID => null)
    SALARY.employee_id => null)

You can always output more relevant information to correlate queries with your application processes. Think of adding time, thread ID, query accessor's connection, or custom context information.
