WebLogic EJB and load balance
I've been recently asked about the load balancing feature of @Remote @EJB interfaces on the WebLogic.
Are remote interfaces load-balanced? Does it depend on the context? Is the invocation load balanced or only the lookup?
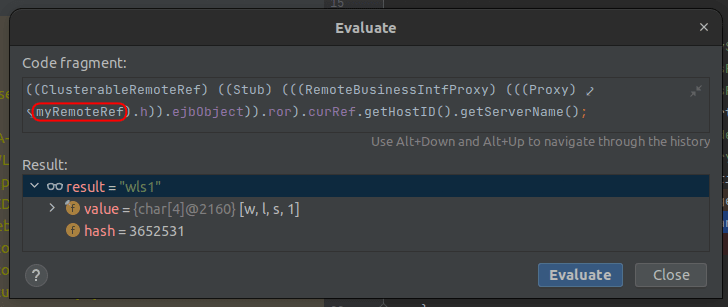
From the client side, can we find out which cluster node processed the request?
Understanding these concepts is foremost in improving one's ability to implement performant and scalable processes.
Load balancing characteristics for stateless EJB remote interfaces
To answer these questions, let's first refer to the WebLogic 14.1.1.0 documentation (though you will find similarities even in the older versions). It describes load balancing characteristics for stateless EJB remote interfaces. In short, you can have two types of connections:
- client-to-server;
- server-to-server.
The client-to-server connections and invocations are load-balanced using one of the three strategies: round-robin (default), weigh-based, or random. Alternatively, load balancing can be turned off in favor of the server-affinity. With server affinity, you are still subjected to load balancing but only if you use cluster URI instead of managed server, and only at the level of creating a new initial context. All these options support failover.
For server-to-server connections, it's essential to understand that the server affinity option does not impact the load balancing between the servers.
Moreover, within one cluster, WLS will always use an EJB that resides on the same node that received the request, as it is much more efficient.
So-called object collocation renders the use of @Remote interfaces within @EJB's suboptimal (unnecessary serialization).
Coincidentally, a similar behavior is described for handling client UserTransaction and optionally for XA.

No collocation (contrary – load balancing) happens between the separate clusters e.g., in a per-tier cluster configuration of a multi-tier web application setup. If you don't want the collocation, the alternative option for processing is through the load-balanced JMS destinations. Otherwise, I imagine you could proxy the lookup through a custom classloader acting as a WLS client, but it is not something tested or recommended.
Figuring out which server handled my (client) request
Sometimes, you might want to know which servers handle some specific requests. I once encountered a desynchronized deployment of a new application version on a cluster that resulted in receiving two different responses in a round-robin manner. Figuring out how to link the response with a specific server enabled me to resolve the issue without unnecessary redeployment or shutting down the entire cluster.
One way is to implement request/response identifiable logging.
Is there something that we could use ad-hoc?
If you've worked with WLS, you might already know that such information might be present somewhere
within the objects of the wlthint3client.jar library.
It is used for connecting to the WLS and contains load-balancing balancing logic for the t3 protocol.
But there's more to it. For the load-balancing, there is a specific logger that you can use. Without it, you would have to rely on creating a custom wrapper around EJB stub calls that reaches into the internal state of the referenced load balancer.

Wlthint3client logging uses JUL (Java Util Logging) underneath. For a 3rd party logging framework integration, look for a bridge like jul-to-slf4j.
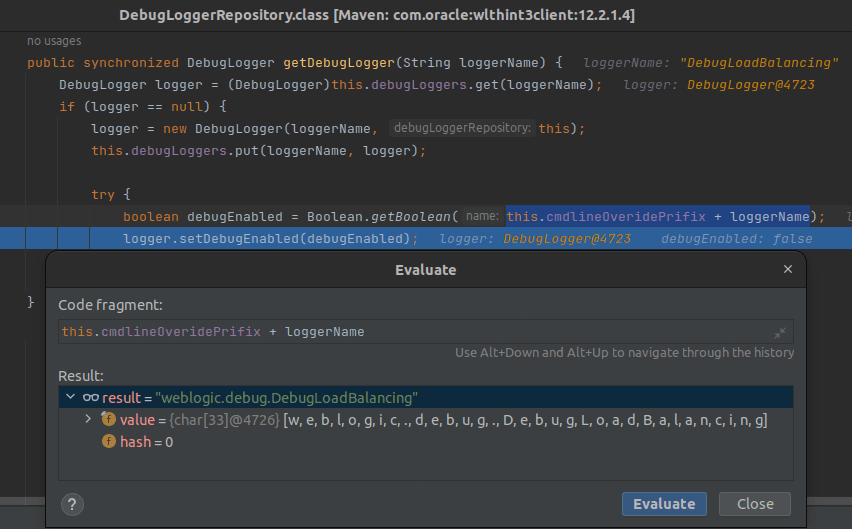
To enable logging, either start the application with -Dweblogic.debug.DebugLoadBalancing JVM property or do it programmatically for the shared logger:

weblogic.diagnostics.debug.DebugLogger
        .getDebugLogger("DebugLoadBalancing")
        .setDebugEnabled(false);
Next you should configure the logging level and appending according to your framework.
Here, the displayName is the logger name with a removed Debug prefix, i.e., JUL logger name becomes LoadBalancing.
With this, you may expect log entries like below:
JUL|FINE|my-exampl-earmy-ejb_jarcom_example_MyBean_MyRemoteBean request routing from 8754691235748961325S:10.90.0.4:[7001,7001,-1,-1,-1,-1,-1]:mydomain:wls1 to 6654312976543210890S:10.90.0.5:[7001,7001,-1,-1,-1,-1,-1]:mydomain:wls2
JUL|FINE|my-exampl-earmy-ejb_jarcom_example_MyBean_MyRemoteBean request routing from 6654312976543210890S:10.90.0.5:[7001,7001,-1,-1,-1,-1,-1]:mydomain:wls2 to 7890564123879561234S:10.90.0.6:[7001,7001,-1,-1,-1,-1,-1]:mydomain:wls3
JUL|FINE|my-exampl-earmy-ejb_jarcom_example_MyBean_MyRemoteBean request routing from 7890564123879561234S:10.90.0.6:[7001,7001,-1,-1,-1,-1,-1]:mydomain:wls3 to 8754691235748961325S:10.90.0.4:[7001,7001,-1,-1,-1,-1,-1]:mydomain:wls1
Combined with a thread name and time (logging format), or other context-related information, it allows linking each request with a specific business process and EJB node.
Another useful logger is DebugFailOver and less so, DebugMessaging. The last one mostly works after additional -Dweblogic.kernel.debug=true and outputs
messages into the console in a byte-pretty format.
