Freeing up dblink connection resources
OracleDB DBlink is a feature that allows you to establish a connection to another database instance.
create public database link remote
    connect to MY_USER identified by MY_PASSWORD
    using '(DESCRIPTION=(ADDRESS=(PROTOCOL=TCP)(HOST=localhost)(PORT=1521))(CONNECT_DATA=(service_name=ORCLPDB1)))';

select * from dual@remote;
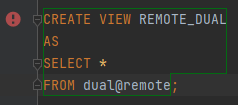
An interesting characteristic of such a connection is the implicit transaction lock on undo segments starting with a simple SELECT query on a dblink table. This feature is described in the administrator guide for version 11.2. From the application point of view, this is particularly interesting in terms of resource release. Even more so when the dblink access can be hidden under a view or procedure.

Connection pool
A typical application often uses some kind of connection pool. Depending on the technology and level of abstraction, pool usage can:
- be hidden from the user and handled entirely by the server/container (JPA/JTA);
- happen on the user's request (direct access to the DataSource), whose responsibility is to release the resources allocated in the session.
When such a connection is no longer needed by the application (declarative end of a transaction/connection close command), it returns to the pool. Later on, it can be reused without being physically closed.
JDBC and dblink
The transactional nature of dblink functionality should put you on guard. You will need a commit or rollback to release the transaction lock. It may seem particularly strange in the following situations:
- using dblink on a connection in auto-commit mode doesn't allow you to invoke a commit/rollback without changing the mode (especially problematic with a non-transactional JTA);
java.sql.SQLException: Could not rollback with auto-commit set on at oracle.jdbc.driver.PhysicalConnection.rollback(PhysicalConnection.java:2427)
- using dblink on a connection in read-only mode, i.e.
SET TRANSACTION READ ONLY;- the transaction lock will happen regardless.
For example, when releasing a connection without releasing the resources allocated by dblink, changing the transaction level on a "fresh" connection might fail:
java.sql.SQLException: ORA-01453: SET TRANSACTION must be first statement of transaction
at oracle.jdbc.driver.T4CTTIoer.processError(T4CTTIoer.java:450)
at oracle.jdbc.driver.T4CTTIoer.processError(T4CTTIoer.java:399)
at oracle.jdbc.driver.T4C8Oall.processError(T4C8Oall.java:1059)
at oracle.jdbc.driver.T4CTTIfun.receive(T4CTTIfun.java:522)
at oracle.jdbc.driver.T4CTTIfun.doRPC(T4CTTIfun.java:257)
at oracle.jdbc.driver.T4C8Oall.doOALL(T4C8Oall.java:587)
at oracle.jdbc.driver.T4CPreparedStatement.doOall8(T4CPreparedStatement.java:225)
at oracle.jdbc.driver.T4CPreparedStatement.doOall8(T4CPreparedStatement.java:53)
at oracle.jdbc.driver.T4CPreparedStatement.executeForRows(T4CPreparedStatement.java:943)
at oracle.jdbc.driver.OracleStatement.doExecuteWithTimeout(OracleStatement.java:1150)
at oracle.jdbc.driver.OraclePreparedStatement.executeInternal(OraclePreparedStatement.java:4798)
at oracle.jdbc.driver.OraclePreparedStatement.execute(OraclePreparedStatement.java:4901)
at oracle.jdbc.driver.OraclePreparedStatementWrapper.execute(OraclePreparedStatementWrapper.java:1385)
In reality, it will look as follows:
-- app conn 1 (physical conn 1)
SET TRANSACTION READ ONLY;
select * from dual@remote;
-- app conn 1 closed (physical conn 1)
-- app conn 2 (physical conn 1)
SET TRANSACTION READ ONLY; -- error
Verification/debugging
To check if the problem is relevant to your application, you verify the open transactions on the database. You will need SELECT permissions on the following system views:
GRANT SELECT ON V_$TRANSACTION to MY_USER; -- active transactions
GRANT SELECT ON V_$SESSION to MY_USER; -- sessions
GRANT SELECT ON V_$SQL to MY_USER; -- recent queries in the sessions
GRANT SELECT ON V_$PROCESS to MY_USER; -- session-process association
GRANT SELECT ON V_$DBLINK to MY_USER; -- dblink connections and transaction statuses, but only for the current session
Once you've got the permissions, it's time for the query:
SELECT session_.SID
     , session_.SERIAL#
     , session_.USERNAME
     , session_.OSUSER
     , session_.PROGRAM
     , session_.EVENT
     , TO_CHAR(session_.LOGON_TIME,
               'YYYY-MM-DD HH24:MI:SS') as LOGON_TIME
     , TO_CHAR(transaction_.START_DATE,
               'YYYY-MM-DD HH24:MI:SS') as START_DATE
     , session_.LAST_CALL_ET
     , session_.BLOCKING_SESSION
     , session_.STATUS
     , (SELECT query_.SQL_TEXT
        FROM V$SQL query_
        WHERE query_.SQL_ID = session_.PREV_SQL_ID
          AND ROWNUM <= 1)              AS PREV_SQL
     , (SELECT query_.SQL_TEXT
        FROM V$SQL query_
        WHERE query_.SQL_ID = session_.SQL_ID
          AND ROWNUM <= 1)              AS CURRENT_SQL
FROM V$SESSION session_,
     V$TRANSACTION transaction_
WHERE session_.SADDR = transaction_.SES_ADDR;
In the above query, take a look at the following columns:
LAST_CALL_ETshowing the number of seconds since the last activity in the session;START_DATEof the transaction corresponding to some event in the application;- the previous
PREV_SQLor currentCURRENT_SQLquery in the session;
Usually, this information is sufficient to identify the source of the problem.
Logs
Tracing the calls at the JDBC level may help you accurately associating an open transaction to a specific process.
Have a look at the OJDBC logging configuration.
In short, you will need a driver built for logging i.e. with suffix _g, e.g. from a Maven repository:
<dependency>
    <groupId>com.oracle.database.jdbc.debug</groupId>
    <artifactId>ojdbc8_g</artifactId>
    <version>21.7.0.0</version>
</dependency>
After basic configuration, you will notice logs matching the connection establishment (logon events) and invoked queries:
2022-10-02 10:59:12.150  INFO 524 --- [main] oracle.jdbc: setCollectionUsageThreshold<PS Old Gen>(5136659251)
2022-10-02 10:59:13.018  INFO 524 --- [main] oracle.jdbc: Connection.logon: oracle.jdbc.driver.T4CConnection@66f659e6
2022-10-02 10:59:13.018  INFO 524 --- [main] oracle.jdbc: Operating System Process Identifier (SPID): 2411
2022-10-02 10:59:13.018  INFO 524 --- [main] oracle.jdbc: DRCP Enabled: false
2022-10-02 10:59:13.029  INFO 524 --- [main] com.zaxxer.hikari.HikariDataSource: HikariPool-1 - Start completed.
2022-10-02 10:59:13.795  INFO 524 --- [main] oracle.jdbc: 30839E44 SQL: SET TRANSACTION READ ONLY
2022-10-02 10:59:13.900  INFO 524 --- [main] oracle.jdbc: 47E51549 SQL: SELECT * FROM orders@remote
In addition, with the finest logging, you will also find the SID/SERIAL#/TRACEFILE associated with the queries:
Oct 02, 2022 11:32:07 AM oracle.jdbc.driver.T4CConnection getSerialNumber
FINEST: 191A709B Return: 42858
Oct 02, 2022 11:32:07 AM oracle.jdbc.driver.T4CConnection getSessionId
FINEST: 191A709B Return: 285
Oct 02, 2022 11:32:07 AM oracle.jdbc.driver.OracleSql getOriginalSql
FINEST: 360E9C06 Return: SELECT * FROM orders@remote
You will get the session-process association by querying the base:
SELECT *
FROM V$SESSION s
         JOIN V$PROCESS p on s.PADDR = p.ADDR
WHERE p.SPID = 2411;
Unfortunately, such low-level logging can generate tens of MBs of logs per second, so it's best to configure it
only for the relevant packages. You can then identify a specific function by shared thread logs or some correlation ID.
Alternatively, you can add tracking information to the database session through the DBMS_APPLICATION_INFO package.
connection.setClientInfo("OCSID.MODULE", "My application");connection.setClientInfo("OCSID.ACTION", "Generate a report");
